SYED Masood Raza, S NASEEM Shah*, ADEEL Tahir, YASMEEN Bibi
(1. Department of Physics, Federal Urdu University of Arts, Science & Technology, Karachi, Pakistan; 2. Department of Chemistry, Federal Urdu University of Arts, Science & Technology, Karachi, Pakistan)
Abstract: Cu doped Mg(OH)2 nanoparticles were synthesized with varying concentrations from 0 to 10%by a chemical synthesis technique of coprecipitation. X-rays diffraction (XRD) of the samples confirms that all the samples acquire the hexagonal crystal structure. XRD results indicated the solubility limit of dopant in the host material and the secondary phase of CuO was observed beyond 3% Cu doping in Mg(OH)2. The reduction in the size of nanoparticles was observed from 166 to 103 nm for Mg(OH)2 and 10% Cu doped Mg(OH)2 samples, respectively. The shift in absorption spectra exhibited the systematical enhancement in optical bandgap from 5.25 to 6.085 eV. A good correlation was observed between the bandgap energy and crystallite size of the nanocrystals which confirmed the size induced effect in the nanoparticles. The transformation in the sample morphology was observed from irregular spherical particles to sepals like shapes with increasing the Cu concentration in the host material. The energy dispersive X-Ray (EDX) analysis confirmed the purity of mass percentage composition of the elements present in the samples.
Key words: Cu doped Mg(OH)2; nanoparticles; phase purity, optical band gap; morphologies
The nanostructures of MgO and Mg(OH)2have versatile technological applications[1]. Alloys of Mg have unique properties because of low weight and non-toxicity. Mg(OH)2is mostly used as flameretardant filler[2]. It is also used in fertilizer additive,papermaking industry and environmental protection acidic waste neutralizer[3,4]. The metals doping in Mg(OH)2materials produced large luminescence, which is useful for applications in display panels, lasers and optical amplifiers[5-7].
These materials can be used to tune the electronic properties based on successful doping or by creating some vacancies in the Mg(OH)2materials[8]. Copper(Cu) is supposed to be a suitable dopant in Mg(OH)2to tune the optical bandgap of the material. Due to the low potential barrier, CuO can be used to regulate electron field emission properties. It was reported that CuO can be used in manufacturing the gas sensors, solar cells, and optoelectronics devices[9,10]. The Mg(OH)2nanoparticles can be prepared via wet chemical method; the hydration of MgO and dehydration of Mg(OH)2produces each other interchangeably[11,12].
We have synthesized Cu doped Mg(OH)2with varying Cu concentration from 0 to 10% to investigate the phase purity and the influence of doping on the optical properties and morphology of the nanoparticles.
Pure Mg(OH)2nanoparticles were synthesized by chemical synthesis technique of coprecipitation[13].All chemicals were of analytical grade. 1 M solution of Mg(NO3)2·6H2O was prepared in 400 mL of doubly deionized water and another 2 M solution of NaOH was prepared in 100 mL doubly deionized water. The solution of NaOH was added drop wise in the mother solution with continuous stirring. The obtained solution was stirred and heated continuously for 5 hours at 60℃ to complete the reaction. Thereafter, the solution was dried at the temperature of 80 ℃ in furnace for 24 hours and final yield was annealed at 300 ℃ for 3 hours. 1% Cupper (Cu) doped Mg(OH)2samples was prepared by making two solutions of metal precursor.The desired amount of Mg(NO3)2·6H2O (0.99 M) and Cu(NO3)2·3H2O (0.01 M) were prepared separately in 100 mL doubly deionized water. Both solutions were mixed to obtain the mother solution. The solution of NaOH was added in the mother solution with continuous stirring at 60 ℃ for 5 hours. After that the mixture was dried at 80 ℃ for 24 hours. The obtained yield of the sample was calcined at 300 ℃ for 3 hours.The rest of the samples for Cu concentrations of 3%,5%, 8% and 10% were prepared with the similar procedure.
Bruker, D8 advance diffractometer was used to record the XRD spectra of the samples with steps size of 2 degree for values from 0° to 70° The morphology of the obtained nanoparticles was observed by scanning electron microscopy (SEM) (JSM 6380A JEOL,Japan) equipped with the EDX. Beckman Coulter-730 spectrophotometer was used to record the absorption spectra with steps size of 1 nm.
3.1 Structural analysis
Fig.1 shows the X-ray diffraction spectra of Cu doped Mg(OH)2nanoparticle with Cu concentration from 0-10%. The results show that the nanoparticles have the hexagonal crystal structure. All peaks are well matched with the standard peaks for Mg(OH)2material(JCPDS file No. 44-1482)[14]which indicates the phase purity of the samples up to 0-3% Cu doping. However,the few additional peaks were observed in the XRD spectra due to aggregation of secondary phase (CuO)beyond 3% Cu doping and these additional peaks of CuO are agreed with standard values of CuO[15](JCPDS file No.05-0661).

Fig.1 XRD spectra of 0-10% Cu doped Mg(OH)2 samples
It is observed that Cu concentration in Mg(OH)2caused the peaks shifting towards higher values of 2θ.It could be due to greater ionic radii of Cu2+(0.73 Å))as compared to Mg2+(0.72 Å) and the observed shift in the peaks clearly indicate Cu2+ions are successfully substituted at Mg2+site. There are few additional CuO peaks identified in the XRD spectra for Cu concentration exceeding 3% (Fig.1).
The appearance of these peaks beyond 3% of Cu doping indicate the solubility limit of the dopant in the host materials. The crystallite size of the samples was estimated by using Debye-Scherrer formula[16]and its values are tabulated in Table 1. The crystallite size of the sample gradually decreases from 166 to 103 nm with increasing the dopant concentrations. The values ofc/aratio for 0-10% Cu doping Mg(OH)2are shown in Table 1 and this ratio for pure Mg(OH)2is found to be 1.67. However, the values ofc/aratio for 1%-10% Cu doping increases with increasing the dopant concentration (Table 1). This change is attributed to the micro strain produced in the host material. The estimated values of crystallite sizes, bond lengths of Mg-(OH),c/aratio, lattice parameters, andd-values are tabulated in Table 1. The variation in these calculations
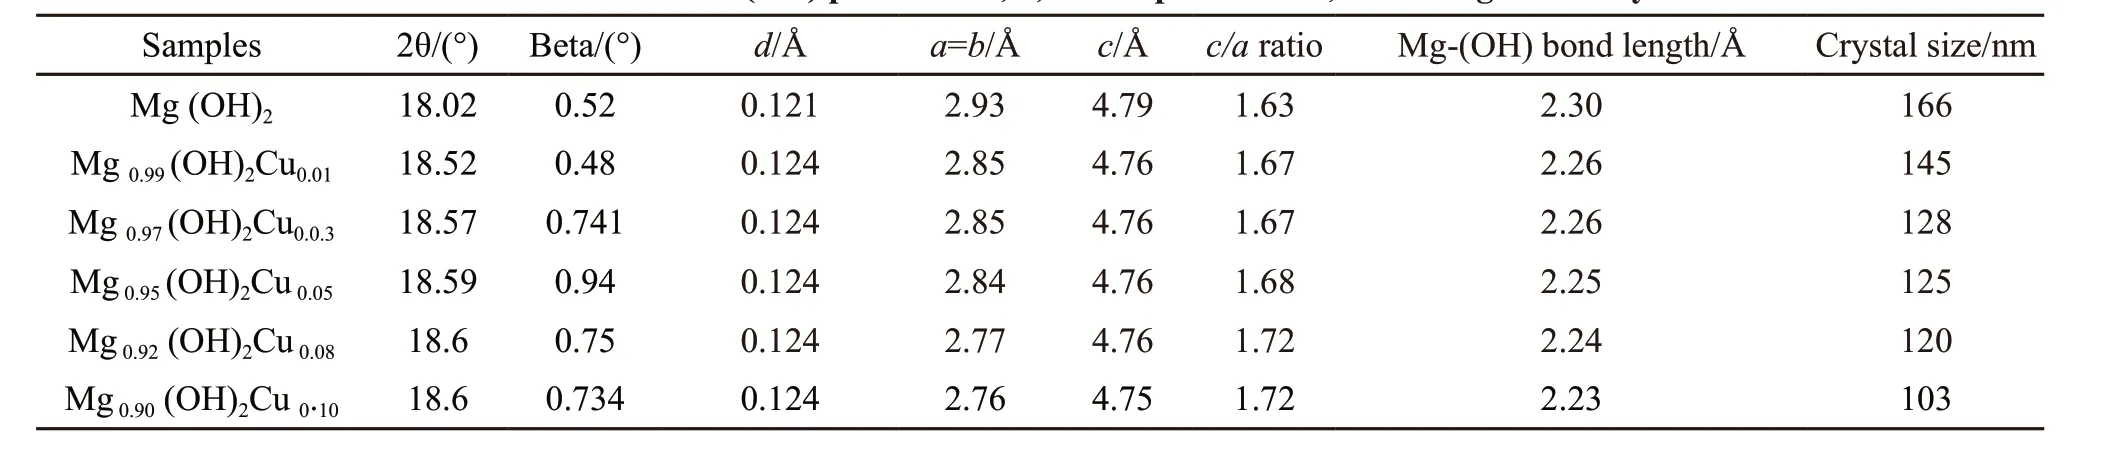
Table 1 Estimated values from (001) peak for 2θ, d, lattice parameters, bond length and crystallite size
were observed which confirmed that Cu is successfully doped in the host material.
The plot of lattice constantcversesCu concentrations for Vegard’s law is shown in Fig.2. According to this law[17], the linear fitting on the experimental data and the observed decreasing trend incvalues clearly indicate that Cu2+has successfully replaced Mg2+ions in the host material.

Fig.2 The plot for Vegard`s law as lattice parameter c vs Cu concentration
Fig.3 shows SEM images of our samples.The observed morphology of Cu doped Mg(OH)2sample almost looks like spherical particles for Cu doping of 0-1%. This morphology of the synthesized samples originates from to nitrate ion present in metal precursor[7]. Beyond 3% Cu doping, the change in the morphology was observed. The morphology of the sample transformed into irregular sepals like shaped particles and agglomerated nano-crystallites. This transition in the morphology was due to the formation of excess Cu2+ions with increasing Cu concentration.When NaOH was added to the solution, the OH−ions react with metals (Cu2+& Mg2+ions) to form hydroxo ions of the metals[13]and form the nuclei for the growth of the nanocrystals[18].
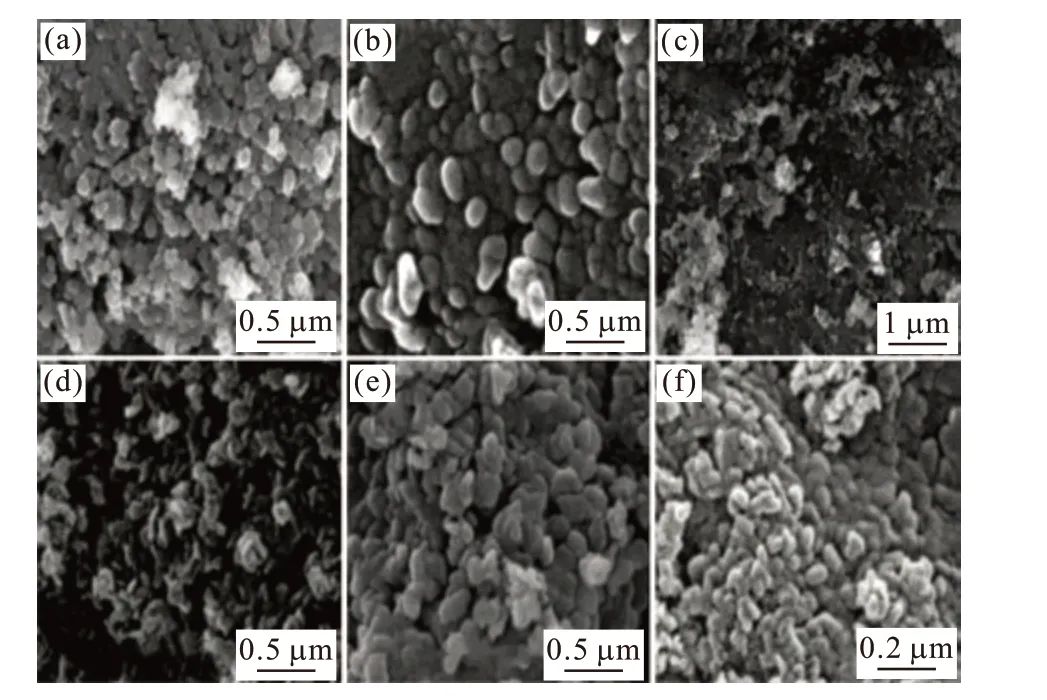
Fig.3 SEM results of (a) pure, (b) 1%, (c) 3%, (d) 5%, (e) 8% and(f) 10% Cu doped Mg (OH)2 samples
Fig.4 shows the EDX spectra of the samples. The dopant concentrations of Cu in Mg(OH)2are found to be in good agreement with the stoichiometry during the synthesis process. No other impurities are found.
3.2 Optical bandgap
The recoded absorption spectra at room temperature for Mg (OH)2and Cu doped Mg (OH)2are shown in Fig.5. Mg (OH)2sample shows a broad absorption peak at about 212 nm. The variations in the shifting of wavelength are observed in the absorption spectra with increasing dopant content in the samples.These excitonic absorption edges for all sample shows the band-to-band transitions[19].

Fig.5 The absorption spectra of 0-10% Cu doped Mg (OH)2 samples
To analyze this absorption quantitatively, we plot a graph between the values of (ahv)2andhvfrom Tauc equation[20]as shown in Fig.6, whereαis absorption coefficient,his Planck’s constant,vis frequency of light. The values of bang gap were measured by extrapolating the straight line from the absorption edges (vertical axis) to thehv(horizontal axis).
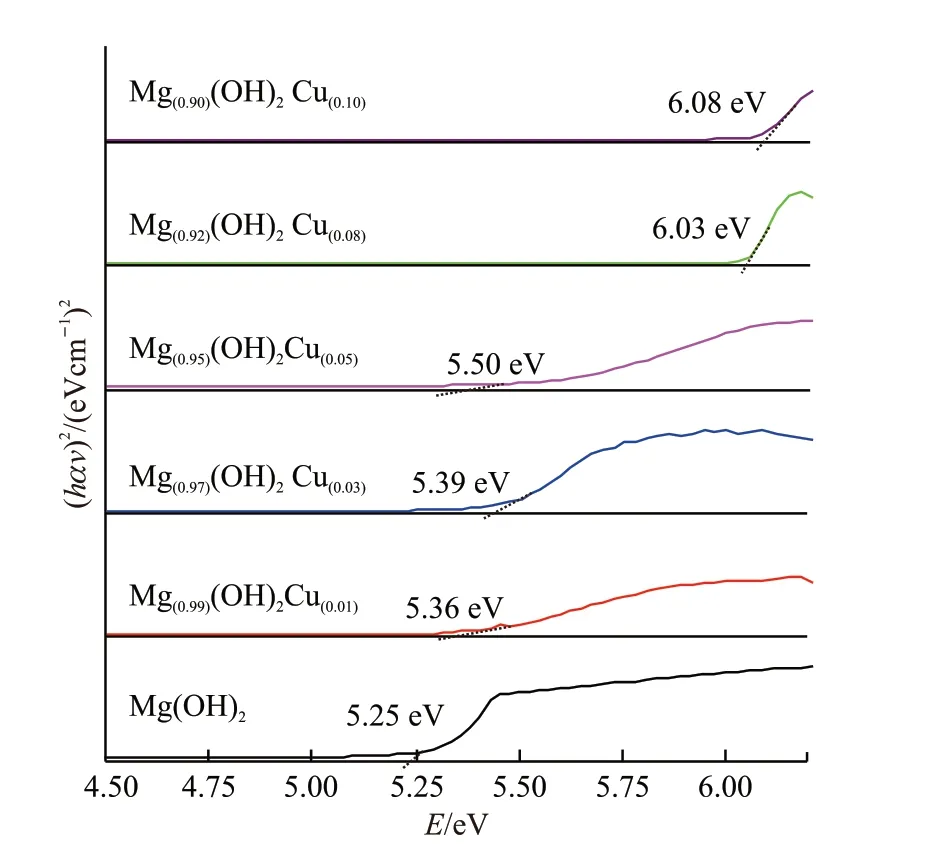
Fig.6 Plots of absorption coefficient (ahv)2 vs incident radiation E for 0-10% Cu doped Mg(OH)2 samples
It can be seen from the graph that there is an increase in bandgap from 5.25 to 6.08 eV for pure Mg(OH)2) and for 10% Cu-doped Mg(OH)2) samples respectively. This increase in the bandgap values and shifting in the absorption spectra are due to spin exchange interaction between the band electrons and localizeddelectrons of copper ions doped successfully at the Mg sites in the Mg(OH)2lattice[21].
We plotted the graph between the bandgap energy and crystallite size to study the size effect on bandgap energy (Fig.7). Fig.7 shows clearly that bandgap energy of the samples increases with the reduction in the size of the crystallite and this is due to the quantum size effect in the nanoparticles[22].

Fig.7 The plot for energy bandgap as a function of crystallite size
0-10% Cu doped Mg(OH)2samples are successfully synthesized by co-precipitation. The obtained crystals of Cu doped Mg(OH)2samples showed the hexagonal structure. Another phase of CuO appeared in the samples beyond 3% of Cu doping in Mg(OH)2nanoparticles. The crystallite size and bandgap energy are in good agreement. The slight transformation in the morphologies are observed with increasing dopant concentration.
Conflict of interest
All authors declare that there are no competing interests.